 Stay Home Trading Stay Home Trading
"I won't give you a tree. I'll show you how to grow a forest."
This course builds from the ground up. Start with the language of options, then learn how to read a contract, judge probability, and pick the right strategy for your view on price.
An option is a derivative — its value comes from another asset. Options can be based on stocks, commodities, FX, bonds, energy and more. You use them when you have a view on where the price is heading.
Every options trade starts with an opinion about direction:
Options are fundamentally about rights and obligations:
There are countless strategies, but only four core building blocks. Everything else — bull put spreads, iron condors, strangles, straddles — is just a combination of these.
Pay a premium for the right to buy at a set price. Profits if the price rises.
Pay a premium for the right to sell at a set price. Profits if the price falls.
Collect a premium, taking the obligation to sell if assigned. Profits if price stays flat / falls.
Collect a premium, taking the obligation to buy if assigned. Profits if price stays flat / rises.
One option contract covers 100 shares. Premiums are quoted per share — a premium of $0.55 means 0.55 × 100 = $55 for one contract. Every dollar figure in options — premium, collateral, profit and loss — is that per-share number times 100.
A contract is usually written as a single line. Tap each part below to decode it.
The stock code (ticker) of the underlying asset. Here it's Microsoft. This is the company whose price your option tracks.
When you open an option chain, you're hit with a wall of numbers. So many prices are listed — how do you read them? Each row is a strike price; each column tells you something about that contract.
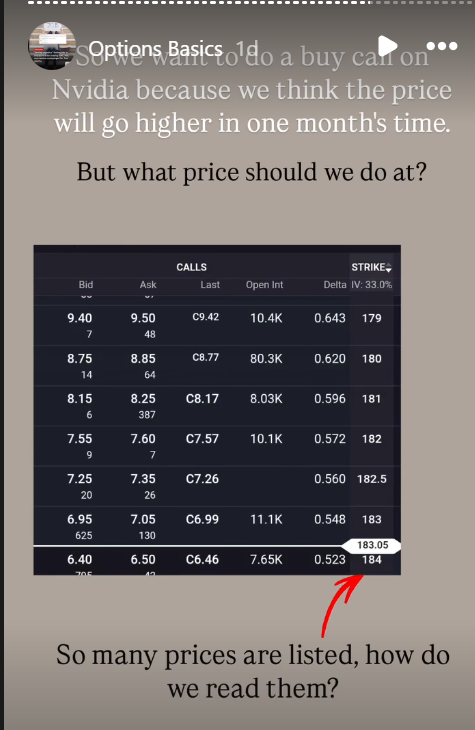
Here's a real call chain for Nvidia. Each row is a strike (179, 180, 181…), and across the row you get the Bid, Ask, Last traded price, Open Interest and Delta. Once you know what each column means, the "wall of numbers" becomes a menu of choices.
The further in-the-money a contract sits, the higher the chance of success — and the more expensive the premium.
As a buyer, a higher probability of success costs you more. As a seller, the lower the buyer's probability of success, the lower the premium you earn from them.
Beyond measuring how much an option's price moves with the stock, Delta can be read as the rough probability of the option being in-the-money at expiry — always from the buyer's perspective.
Taking the Delta column at face value, in roughly one month's time there is about:
Lower strikes sit deeper in-the-money, so they carry a higher probability — and a higher premium.
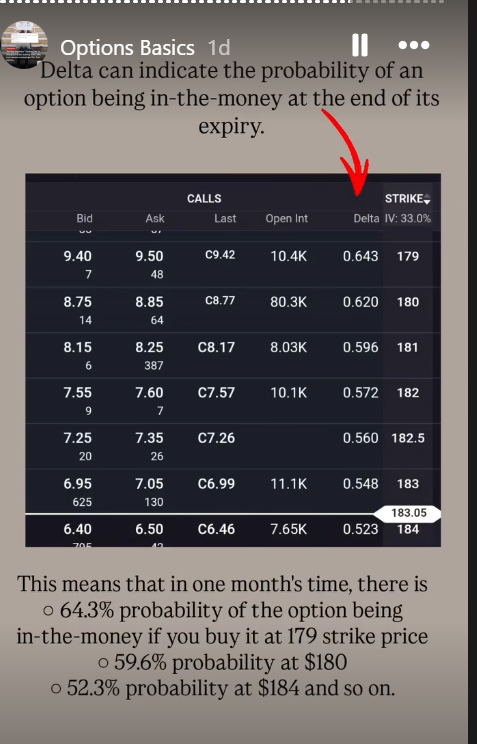
Say a call has a Delta of 0.64. That implies there's roughly a 64% probability the option finishes in-the-money in about a month if you buy it at that strike.
The seller, taking the other side, is effectively betting on the remaining ~36% — and gets paid a premium upfront for taking that risk.
A premium has two parts: intrinsic value (how far the option already sits in-the-money) and time value (the extra paid for what might still happen before expiry).
Time value melts away as expiry approaches — traders call the melt theta. Buyers lose it day by day; sellers earn it. That melt is the whole reason premium-selling strategies like the wheel produce income.
How expensive options are overall is set by implied volatility (IV) — the market's guess at how much the stock will move. When IV is high, the same strike and expiry pays a bigger premium.
Sellers like collecting premium when a stock's options are priced richer than that stock's own normal — more income for the same obligation. Screeners often show this as IV rank.
"Moneyness" is always measured from the buyer's perspective. If an option is in-the-money (ITM), it's in a favourable position that benefits the buyer. Pick a strategy to see what ITM means for each side.
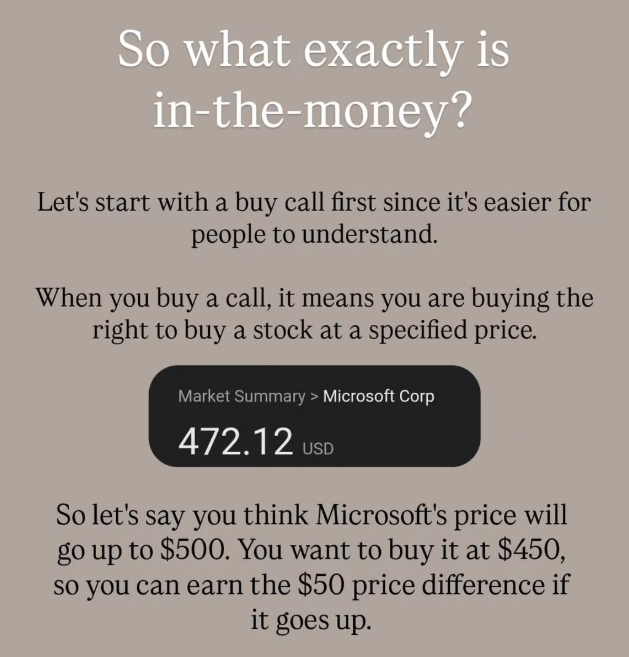
Microsoft is trading at $472.12. Say you hold a call with a $450 strike and you think the price climbs toward $500. You have the right to buy at $450 while the market sits well above it — that option is in-the-money, and you pocket the difference. The deeper ITM it goes, the more it works in the buyer's favour.
Market price at expiry is above the strike. The buyer wants this — they can buy below market.
Market price at expiry is below the strike. The seller wants this — the option expires worthless and they keep the premium.
The mirror rule: As a buyer, you want the option to be ITM at expiry. As a seller, you want it to be OTM — so it expires worthless and you keep the premium you collected.
Each building block maps to a market view. Buy call & sell put are bullish; sell call & buy put are bearish.
You're bullish — you think the price will go up in the next X days. You buy the right to buy the stock at a lower price, expecting it to climb so you capture the increase.
You think the price stays below a level. You sell someone the right to buy the stock at a (usually) higher-than-market price and earn a premium upfront. Sold against 100 shares you already own, this is a covered call — the income trade, and the second half of the wheel. Sold without the shares it's a naked call, where the loss is unlimited if the stock keeps climbing — not for beginners.
You're bullish. You sell someone the right to sell you shares at a pre-specified price. If the stock stays up, it expires worthless and you keep the premium. Why not buy outright? If the price isn't at the level you want yet, get paid while you wait. Your broker reserves strike × 100 in cash as collateral — a cash-secured put — and your worst case is buying 100 shares at the strike with the stock far lower (at most strike × 100 minus the premium, if it went to zero).
You're bearish. You pay a premium for the right to sell at a set price, profiting if the stock falls below your strike.
A stock is bullish when indicators point to rising prices, and bearish when they point to falling prices. Match the strategy to the direction — but always ask: how far will it move, and what strike makes sense?
Let's walk one real setup straight from the @stayhometrading stories: you're bullish on Nvidia and thinking about buying a call. We'll see both the buyer's and the seller's side — including what happens when the trade goes against you.
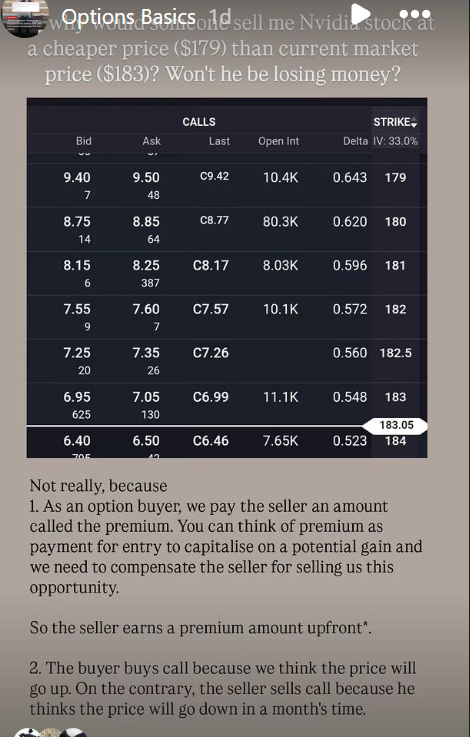
Nvidia trades around $183. You buy the right to buy it at the $179 strike — below market. Isn't the seller losing money selling cheaper? Not really:
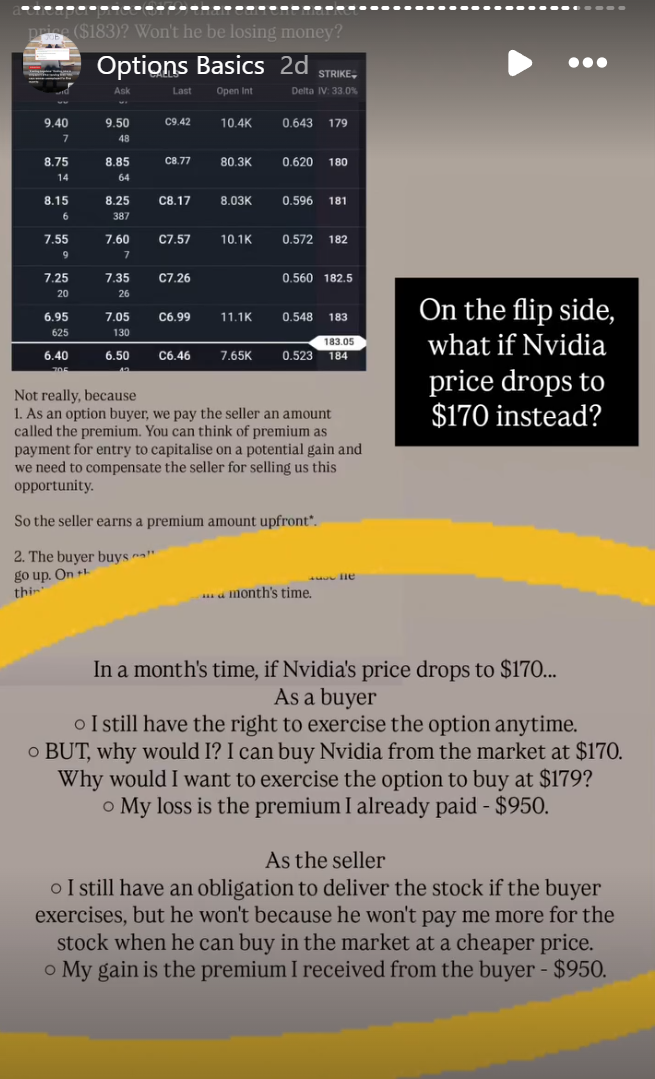
A month later, suppose Nvidia has fallen to $170:
That's the whole trade-off in one picture: the buyer pays a premium for upside with a known, limited downside; the seller earns that premium for taking on the obligation.
The strategy is only half the trade — the underlying matters just as much.
Because selling a put is a bullish strategy, only choose stocks that are currently bullish in nature and look set to continue rising — unless you genuinely don't mind holding the shares for a long time (which may not be the most efficient use of capital).
The wheel puts everything above together: sell puts on a stock you'd be happy to own, and if you end up owning it, sell calls until it's taken away again. You collect a premium at every step, and you only ever trade at prices you chose in advance. One contract = 100 shares throughout.
Pick a stock you'd happily own and a strike below today's price. Your broker sets aside strike × 100 in cash; the premium lands in your account immediately.
Stock stays above the strike → the put expires worthless, you keep the premium, go back to step 1. Finishes below → you're assigned: the reserved cash buys 100 shares at the strike.
Now that you own 100 shares, sell a call at a strike you'd happily sell them at — above your cost. You collect another premium while you hold.
Stock stays below the call strike → keep the premium and the shares, sell another call. Finishes above → your shares are sold at the strike. You're back in cash — start again at step 1.
Cash → puts → shares → calls → cash again. Every turn of the loop collects a premium, and you only ever agree to prices you already picked: you buy at a strike you liked, and you sell at a strike you liked.
Say a steady stock — call it KO — trades at $59, and you'd be happy owning it a little cheaper.
You sell one $57.50 put, five weeks out, for a premium of $0.55 a share — 0.55 × 100 = $55 in your account today. Your broker reserves 57.50 × 100 = $5,750 as collateral. Worst case: the stock goes to zero and you still buy at $57.50 — a maximum loss of $5,750 − $55 = $5,695. That's why you only run this on stocks you'd genuinely own.
Five weeks later the stock closes at $58.20 — above your strike. The put expires worthless. You keep the $55: about 0.96% in five weeks on the $5,750 that was set aside. Your cash is free again — sell the next put.
It closes at $56 instead. The $5,750 buys 100 shares at $57.50. Counting the $55 premium you already kept, your effective cost is $5,750 − $55 = $5,695, or $56.95 a share — with the market at $56 you're down $95 on paper, not $150. Now the wheel turns: you sell a covered call.
You sell one $60 call against your shares for $0.50 a share — another $50. If the stock stays below $60, keep the premium and the shares, and sell another call next month. If it climbs and you're called away at $60, you sell for $6,000: $6,000 − $5,695 + $50 = $355 kept across the whole loop — both premiums plus the rise you agreed to in advance.
Hypothetical numbers chosen so the arithmetic is easy to follow, not a live quote — real premiums move with price, time and IV. Educational only, not financial advice.
The lessons above are the theory. These are the habits shared on the @stayhometrading reels — kept deliberately simple, because the goal is consistent income, not excitement.
"I only use 2 strategies. Everything else is just noise." Those two are the wheel — selling puts to generate consistent income from stocks you'd be happy to own anyway — and credit spreads. Boring pays.
A short check, repeated every single day:
Three orders to set up the moment a trade is on:
"Unless you're staring at the charts without blinking and sleeping, it's always a good idea to set these for every trade." GTC is what locks in profits and stops losses before they get too big — because unrealised profits are no profits.
"Markets are people. People are habits. Indicators are the map." Read them like traffic lights — go, get ready to stop, or no-go — using just a couple of tools in TradingView. Indicators don't predict; they tell you whether conditions are a green light.
After a trade, go back and be honest with yourself: Why did you enter? Why at that price? Why didn't you close at this profit? Why didn't you act when the chart did something? Why didn't you take profit or stop the loss at that level? Reviewing your own decisions is how the next entry gets better.
If you're unsure about options, don't risk real money yet. Brokers like Interactive Brokers offer a paper-trading account — practise the whole process with fake money until the routine feels natural, then go live.
The actual setup is recorded, step by step, on @stayhometrading. These are the reels that matter most for getting your own charts ready — watch them in order. (They open on Instagram in a new tab.)
Indicators work like a traffic system — before crossing the road you don't check just one thing. The case for reading several signals together instead of guessing.
Watch on Instagram ↗A walkthrough of the indicators @stayhometrading actually uses in TradingView, and how to read them as go / get-ready-to-stop / no-go.
Watch on Instagram ↗"Options trading is about balance. RSI helps us assess if the stock price is in balance." Step-by-step RSI setup.
Watch on Instagram ↗A quick, easy way to spot the quality and strength of the prevailing trend. Step-by-step DMI / ADX setup.
Watch on Instagram ↗Setting up moving averages. "Indicators are personal to everyone's trading styles — learn the basics, then adjust on your own."
Watch on Instagram ↗With the indicators configured, this ties it together — how to use them to judge when to enter or exit the market.
Watch on Instagram ↗"The options execution screen will be the screen you use the most." A tour of where you actually place trades.
Watch on Instagram ↗"Your capital is limited — learn how to compute if a trade is worth it" before you tie up money in it.
Watch on Instagram ↗"Trades are like plants. Don't just leave them alone to manage on their own." Includes rolling a sell call for 4–5% across two months.
Watch on Instagram ↗"Stock assignments are not always bad — they can be good income in sideways markets." Reframing what feels like a loss.
Watch on Instagram ↗